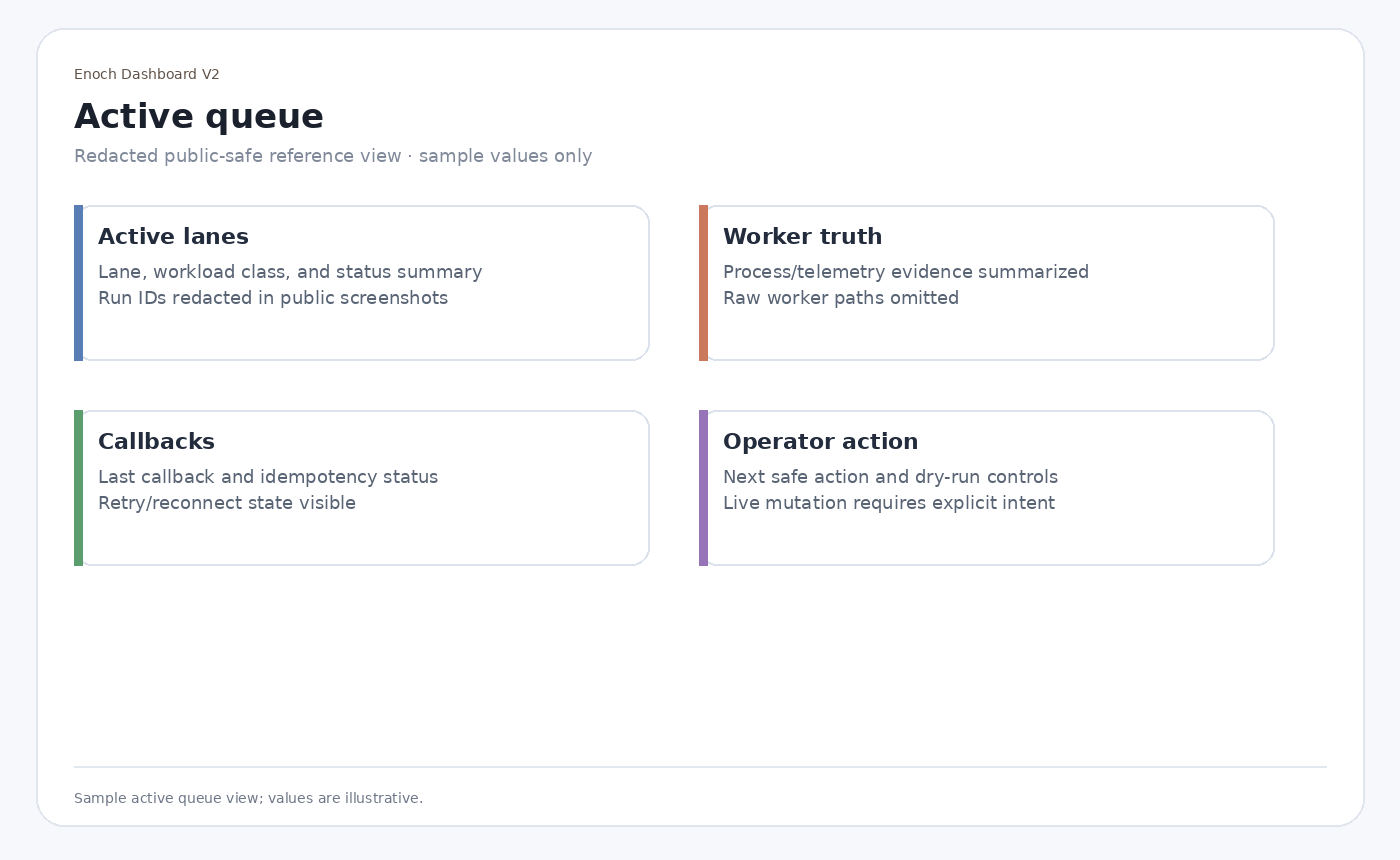
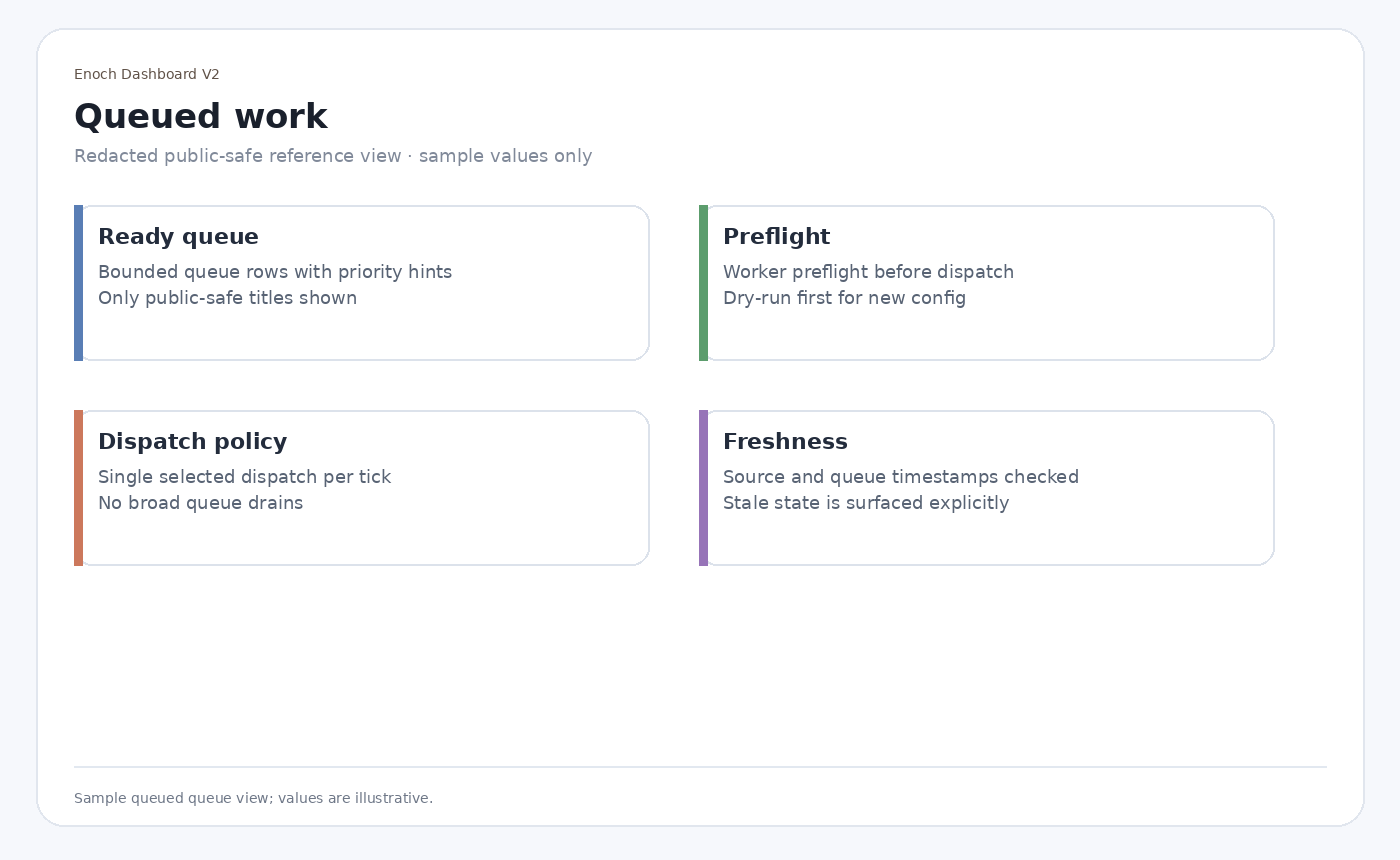
Dispatch flow
Dispatch turns a queued idea into a worker run. Treat it as a guarded operation, not a raw script call.1. Check health and status
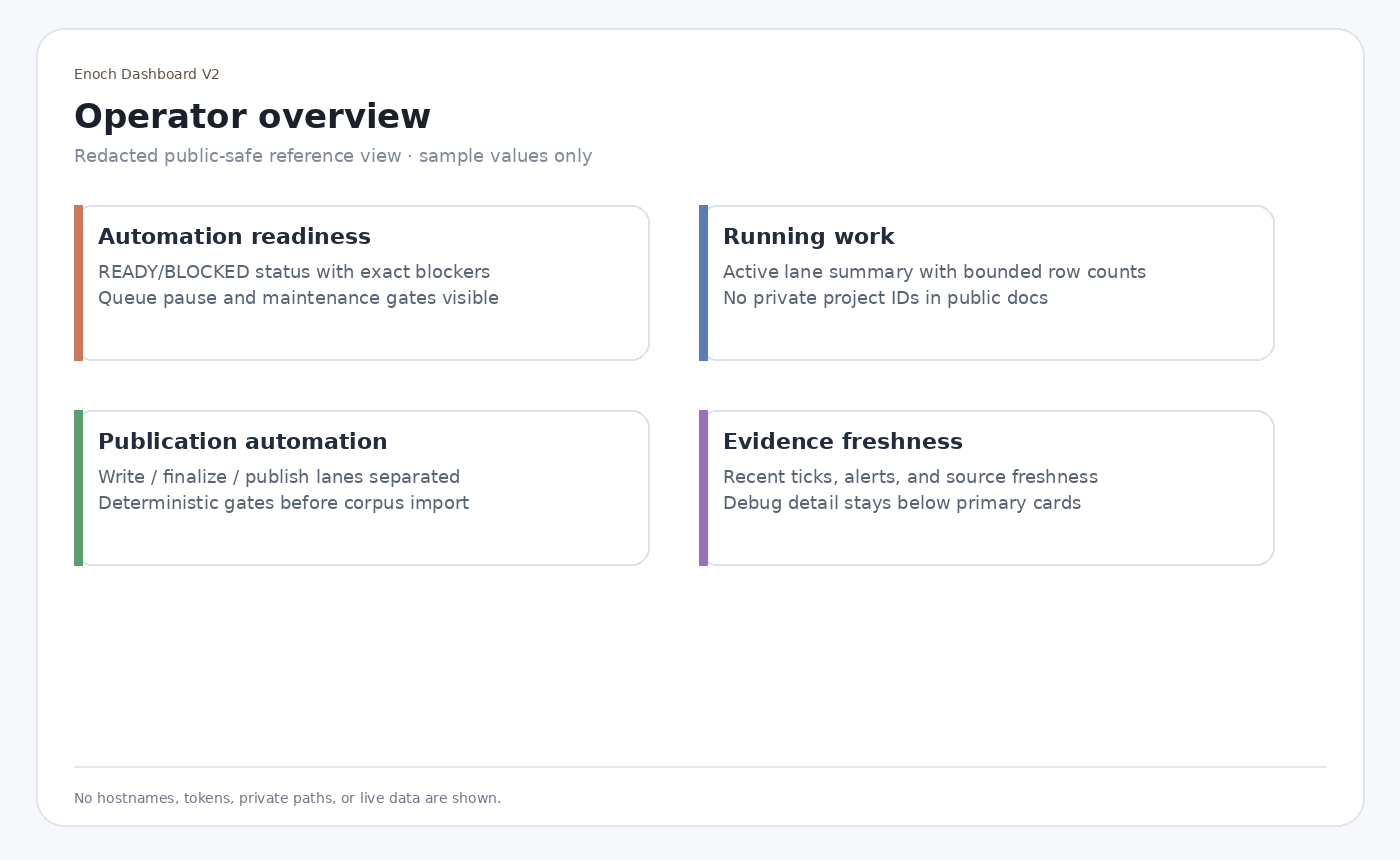
dispatch_safe and dispatch_blockers before proceeding. The operator dashboard UI is at http://<control-vm>:8787/control/dashboard-v2. The older /control/dashboard and /dashboard URLs redirect to the canonical V2 shell on current deployments.
The dashboard image in this section is a redacted, public-safe reference view with sample values. It shows the current V2 information architecture without exposing private hostnames, tokens, project IDs, or live operator data.
2. Check queue health
3. Verify worker preflight
4. Dry-run dispatch
5. Live dispatch
Only after status, queue health, and preflight are understood should you send a non-dry-run dispatch request. Confirmlive_dispatch_enabled and dispatch_script_path are intentionally configured.
What the control plane checks
The queue tabs show the same read model from different operator angles. Empty active and queued views are useful during smoke testing because they prove the dashboard can read canonical queue state without launching work.The two queue-tab images below are redacted, public-safe reference views with sample values. Use them to understand the queue layout, not as live queue evidence.